


Monitoring KPIs is an interesting discipline, undoubtedly strategic for data-driven companies, constantly looking to improve their processes by measuring OKRs (Objectives and Key Results) and other metrics.
The starting point is clear: every company needs to collect data that can be self-generated by mobile applications or from its management system, its 4.0 machinery, and other connected sources.
However, is this information actually consulted at the right time? For example, is operational data displayed to monitor the status of open orders to avoid delays in deliveries, or is it analyzed only later?
These kinds of questions have led us to work closely with many local realities. As a result, we have ascertained the actual needs: keep the focus on operational data and receive real-time updates during the workflow in different production sectors.
It is no revolution: intranets, physical connections, or screen mirroring can sometimes satisfy the required tasks, but are they the right technologies to achieve full operability in modern times?
- How to access on the go via your smartphone and receive push notifications on important updates?
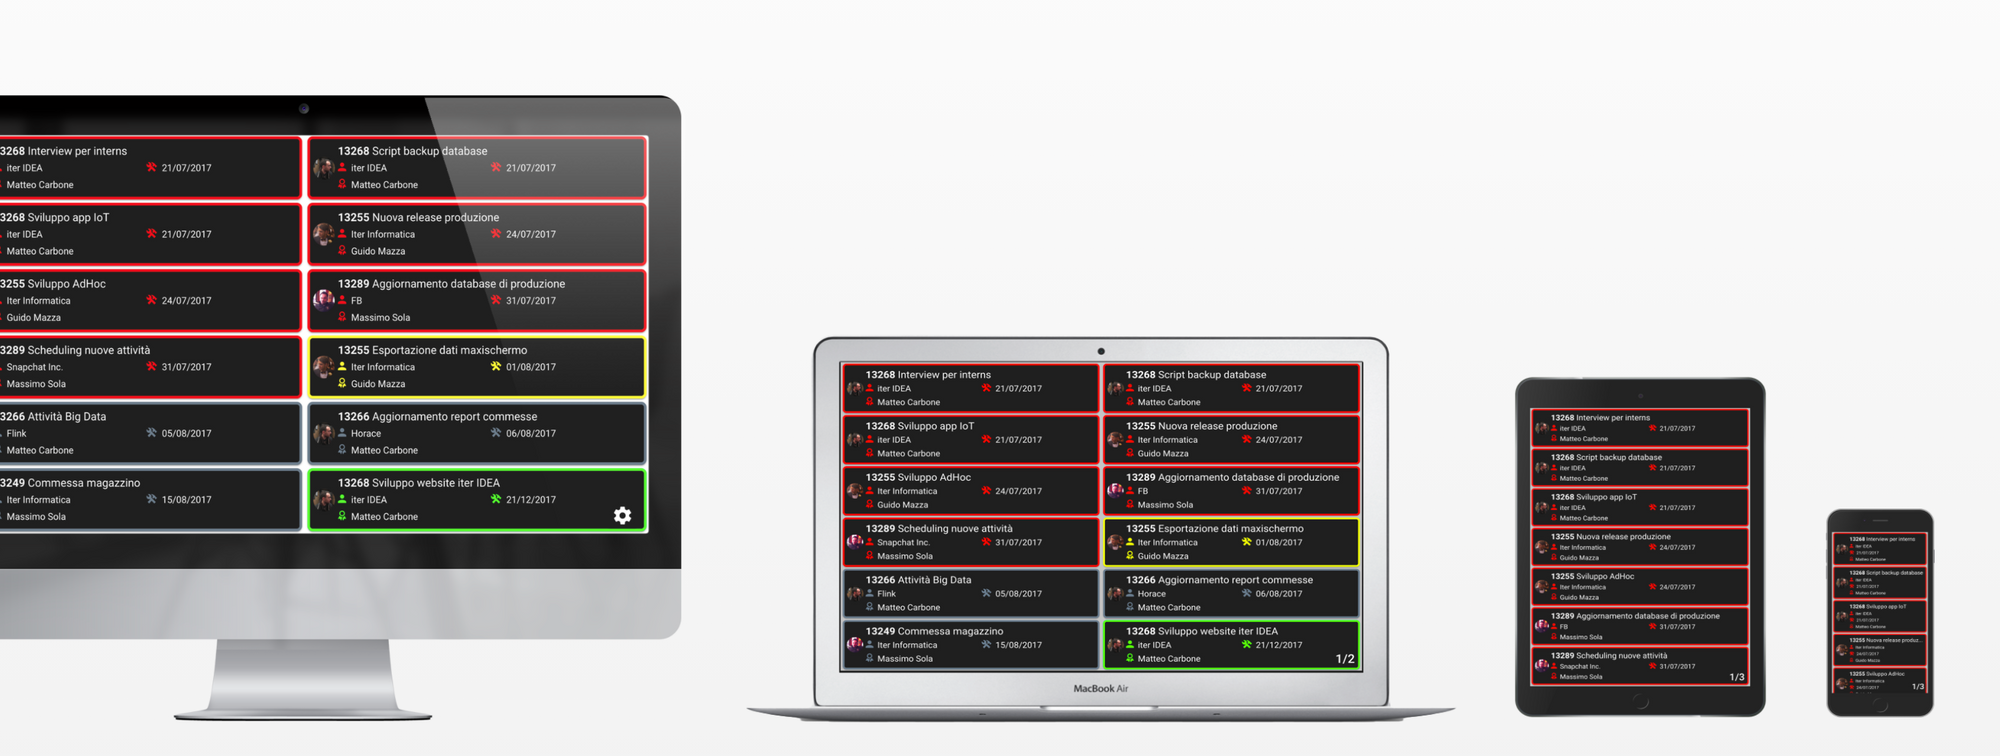
- How to manage the multiplication of dashboards in various company sectors: do we always have a computer available to use reliably for each workstation?
- How can I ask for more from my dashboards in a sustainable way?
Here is how we imagined the ideal solution
Quick dashboard creation and connection, full customization without any technical intervention, easy access to information: it's as simple as turning the TV on!
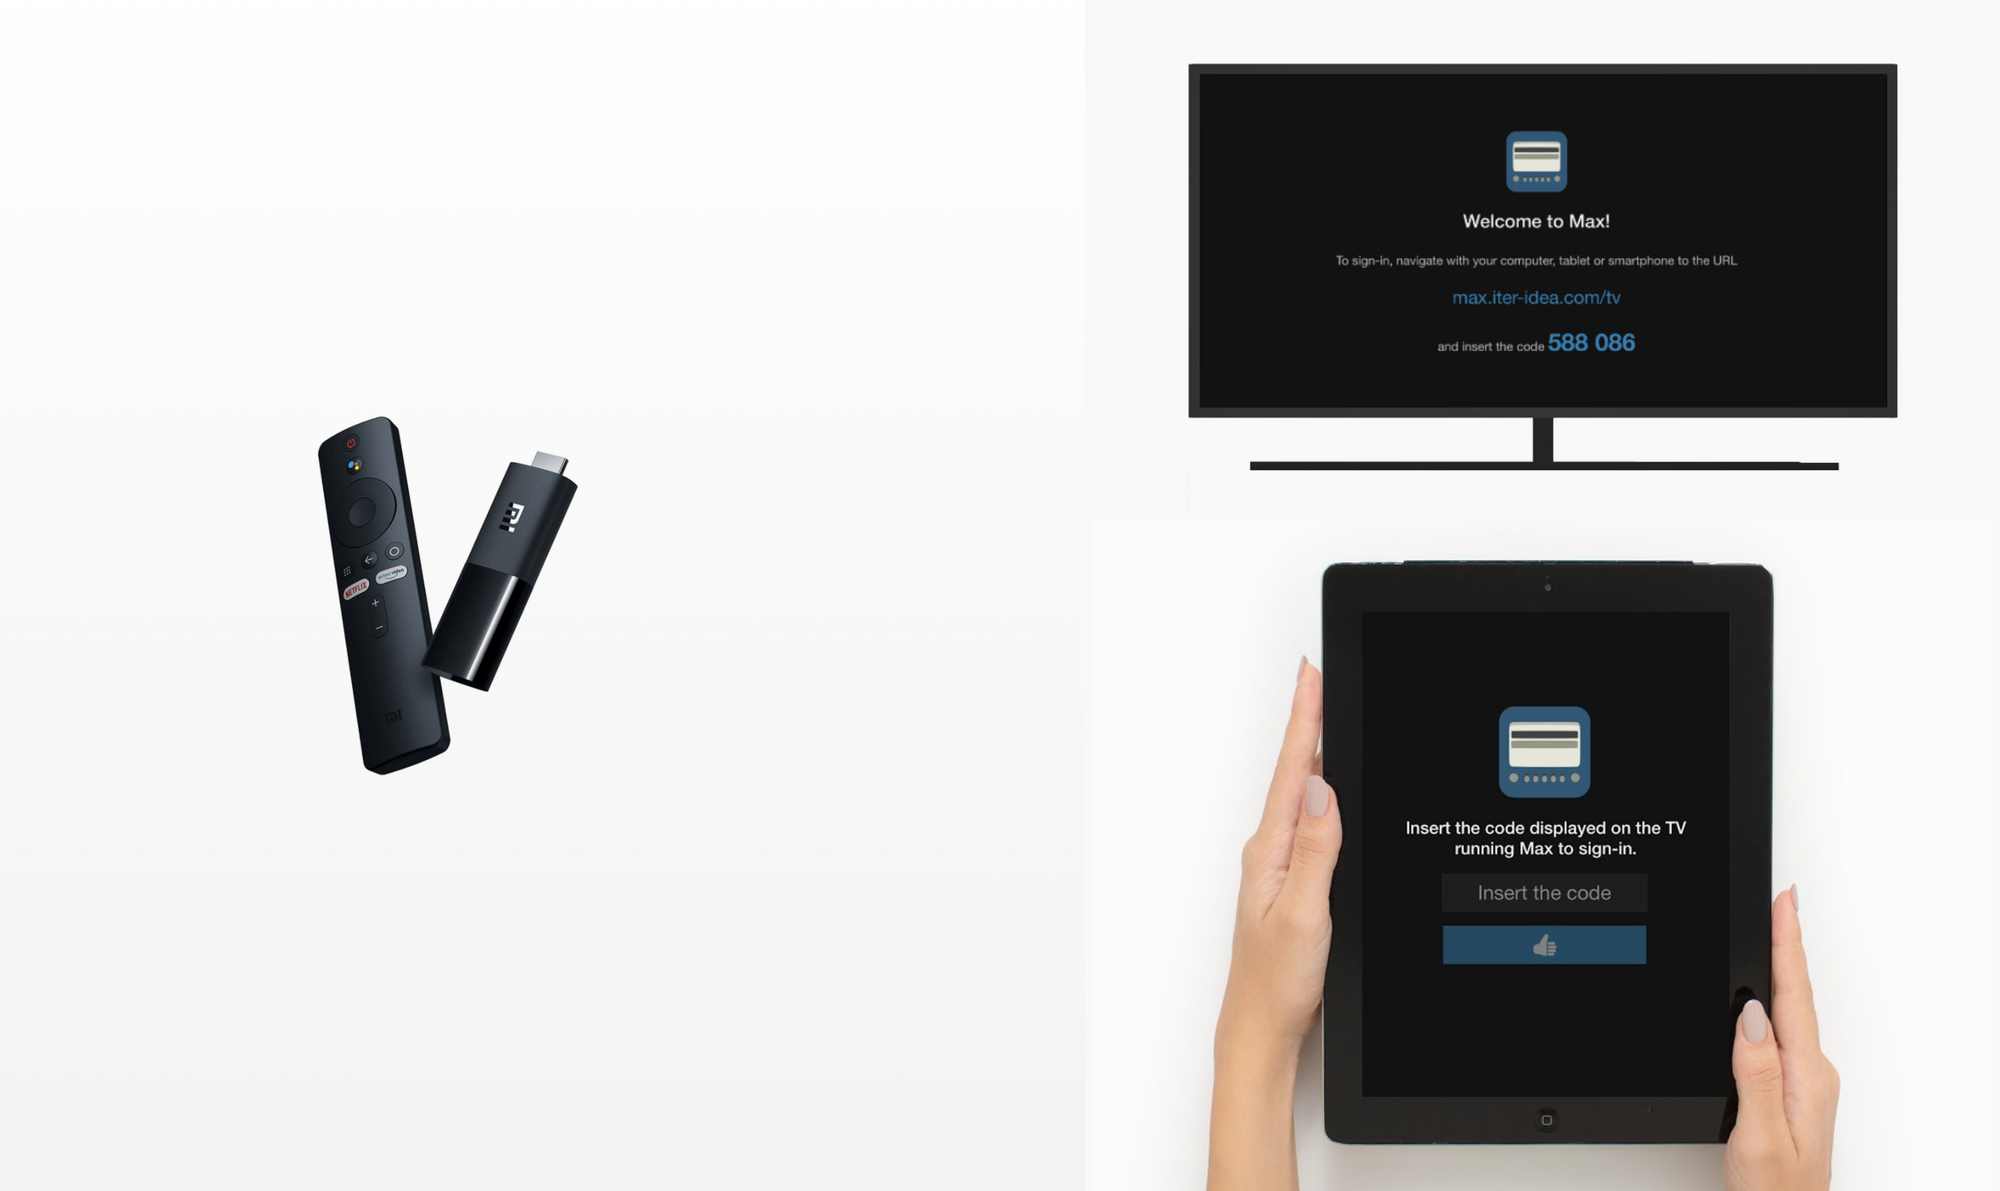
You can download the app on your smartphone, access it via a web browser, and even use the application directly on an Android TV — the sign-in doesn't require the use of a keyboard. In addition, you can select the best dashboard for each different device.
Furthermore, thanks to the compatibility with the ChromeOS operating system, it is also possible to use the app on mini-computer devices in totem mode.
Let's not forget about interconnected services
By exploiting the cloud platform and the ITER IDEA ecosystem, all the apps used by the organization can make their data automatically available. In this way, through a few configurations and without access to other systems, you can create dashboards to view information collected — from activity reporting to warehouse picking.
Consequently, it is possible to answer questions such as:
- What are the most used spare parts in maintenance interventions?
- How many orders have been prepared in the last month?
- Which orders are overdue?
and much more, all without developing a specific connector for your management system.
What about more complicated scenarios?
We have mentioned the integration with Amazon QuickSight, which allows you to create complex dashboards that use advanced graphical tools and powerful machine learning algorithms to add predictive features on trends.
Wondering if the technologies and tools adopted are the best to do a job is the starting point for improving it.


